

Early Retirement Chart
When can you retire at your current income and spending levels?
Saving for retirement boils down to spending less than you make and saving the rest. Thanks to this chart below from Four Pillar Freedom, you can both visualize and calculate your current path at a glance.
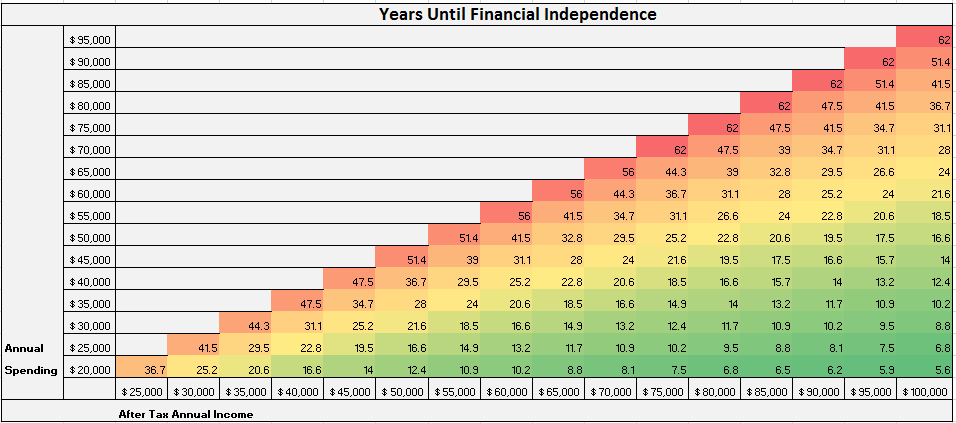
Early Retirement Chart from Fourpillarfreedom.com
Even someone making $100,000 a year, wouldn’t be able to retire for 62 years if they only saved 5% of their salary and spent 95% of it each year. But, someone making $40,000 a year could retire in 16 years if they only spent half of their salary annually. This is retiring 46 years sooner than someone that makes six figures! Lets say you make $4ok and you want to retire as soon as possible. Besides only spending half of your salary each year ($20k), you need to put away more money to retire sooner. So, you find another way to make more money! You get a couple side gigs: doing some odd jobs = $5k/year, consulting = $5k/year, doing some focus groups, product testing, random money making stuff = $5k/year. You have now increased your annual income to $55,000! At that income level you can now retire in just over ten years. Boost your income even more or sell some of your old junk on eBay and Craigslist, save that money, and you’ll have enough retirement income even sooner.
Are you balking at the idea that anyone can live on $20k a year? You shouldn’t be. Tons of people actually do it. Take Mr. Money Mustache for example, his family of 3 spends exactly $25k a year… for three people.
Sure you’ll have to make a few sacrifices and it will take some work to make your finances as efficient as possible, but you can end up retiring much sooner than any of your peers. 🙂


Leave a Comment